Bitcoin Hits $99K: How Close Is BTC to Hitting the $110K Milestone?
- Technical indicators suggest strong bullish momentum for Bitcoin, including a positive EMA crossover and a rising RSI nearing the overbought zone.
- Open interest in Bitcoin derivatives has increased to $61.51 billion, with a bullish long-to-short ratio of 1.0442.
From the bottom of $90,000 earlier this week, the Bitcoin price has recovered nearly 10% and is on the verge of hitting the $100K resistance once again. In the last 24 hours, BTC is up by another 2.5% and is currently trading at $99,113 with open interest surging past $63.3 billion.
Currently, there is a bullish undercurrent building up for BTC as investors look ahead for a solid breakout above $100K in order to begin its next leg of the journey to a new all-time high.
Bitcoin Price Analysis and Technical Chart
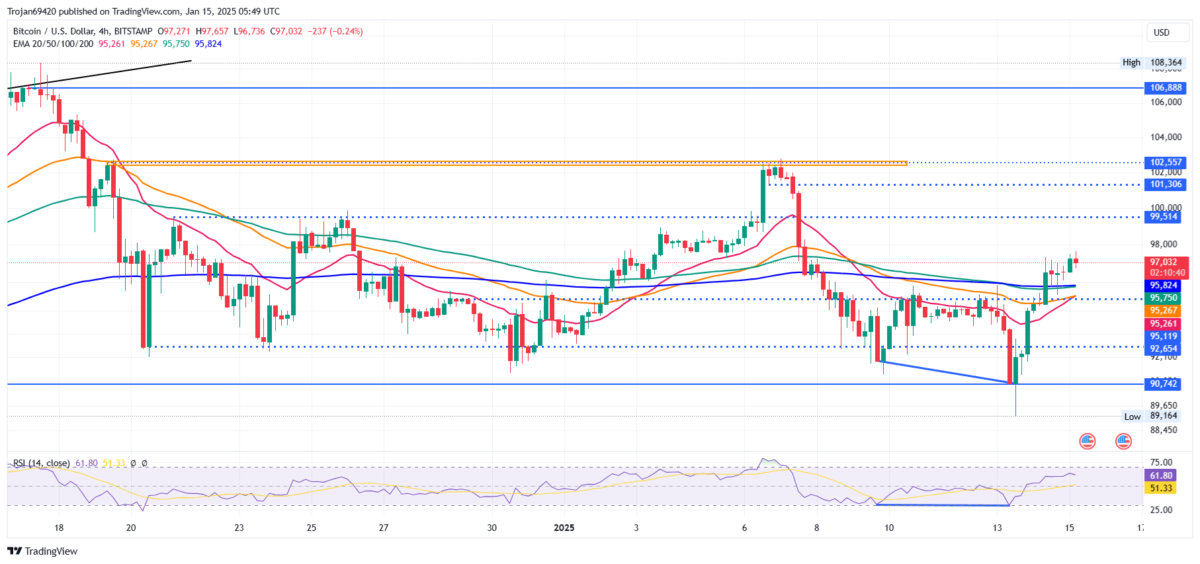
On the four-hour chart, the Bitcoin price action showcases a V-shaped recovery with steady, linear growth. The recent rebound from the lows of $90,000 has evolved into a bullish rally. As of press time, BTC is trading at $99,113 levels, with its market cap shooting to $1.96 trillion.
The rising bullish momentum has resulted in a positive crossover between the 20 and 50 EMA lines, indicating a strong short-term uptrend. Meanwhile, the 100 and 200 EMA lines are approaching a favorable alignment, further reinforcing the bullish outlook.


Additionally, with bullish divergence unfolding as anticipated, the RSI is edging closer to the overbought zone. These technical signals collectively present a compelling buy opportunity for Bitcoin, as highlighted in our previous article.
BTC Derivatives Data and Price Targets
Amid the recent Bitcoin and crypto market recovery, more than $250 million have been liquidated in the crypto market as per the Coinglass data. Of these $160 million are in short liquidations hinting at a bullish reversal in the crypto market.
On the other hand, Bitcoin derivatives data reveals a 1.54% rise in open interest, now totaling $61.51 billion. Notably, the long-to-short ratio has turned bullish at 1.0442, reflecting an increase in long positions. However, the funding rate has declined to 0.0046% from its recent high of 0.0105%.
This indicates that despite the uptick in long positions, traders remain cautious about paying a high premium to sustain their bullish outlook. On the other hand, institutional interest in Bitcoin hasn’t picked up much as total flows into spot Bitcoin ETFs have remained negative so far.
Derivatives data hints at a slight correction, aligning with BTC price action, which suggests a potential retest of the 200 EMA. This retest could present an entry opportunity for a rebound. The 200 EMA is currently positioned at $95,823. Key levels include immediate resistance at $99,514 and critical horizontal support at $95,119.
On the other hand, the December CPI numbers of 2.9%, which are in line with expectations, could serve as a major catalyst for BTC. The Core CPI has dropped to 3.2%, below the expected 3.3%. Also, with Trump’s inauguration less than a week from now, we can expect some volatility in BTC, as detailed in our latest news piece.


Post Comment